 State and Federal environmental agencies require periodic groundwater monitoring or remedial action progress reports for groundwater contamination sites. These reports are used to measure the progress of the environmental investigation or remediation activities being conducted onsite. A typical report will provide information on the stability of a groundwater contaminant plume and/or ascertain the performance of any remedial system(s) installed. The report is submitted to the state’s regulatory agency in a timely fashion, often after each monitoring event, which typically occurs quarterly. The frequency of monitoring and reporting intervals may change, based on direction from the lead regulatory agency.
Depending upon the nature and impact of the contaminants, some environmental projects often continue for decades or more. Sites may continue long-term because they are either difficult to remediate or they have a stable and naturally-degrading plume where it is more cost effective to monitor the progress rather than conduct inefficient remedial intervention at the site.
For the most part, the process for creating the monitoring reports has remained the same as it was in the 1990s. However, recent advances in technology provide the opportunity to automate the entire reporting process from sample results to printer and everything in between. This article will summarize the components of a groundwater monitoring report and technological opportunities that are available to automate report production.
Components of a Groundwater Monitoring Report
Groundwater monitoring reports typically include:
- Monitoring data summary table
- Groundwater flow direction map
- Plume maps depicting the extent of contamination for each chemical compound
- Statistical analysis of sample results
- Summary of information
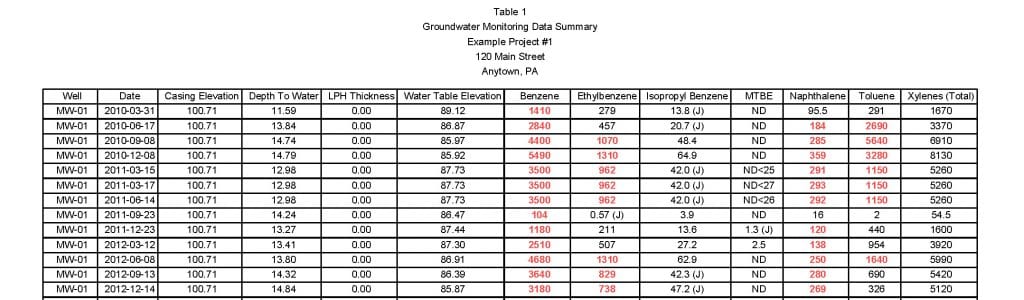
Monitoring Data Summary Table
The monitoring data summary table provides a list of all the data collected from the groundwater monitoring wells since the project began. Monitoring well data includes well casing elevations, depth to water measurements, liquid petroleum hydrocarbon (LPH) thicknesses and groundwater sampling results. The table is organized to present the monitoring well ID, sample date, well casing elevation, depth to water, LPH thickness, water table elevation, and laboratory analytical results for all of the chemical compounds that were analyzed.
The summary table can be created either by manually copying well data from field books and laboratory reports and then entering the data onto a master spreadsheet; by taking electronic laboratory deliverables and pasting it into the appropriate cells in the master spreadsheet and then manually entering well data into the spreadsheet; or by using software to automatically upload laboratory data to a database and using an intuitive and simple interface to enter well gauging data.
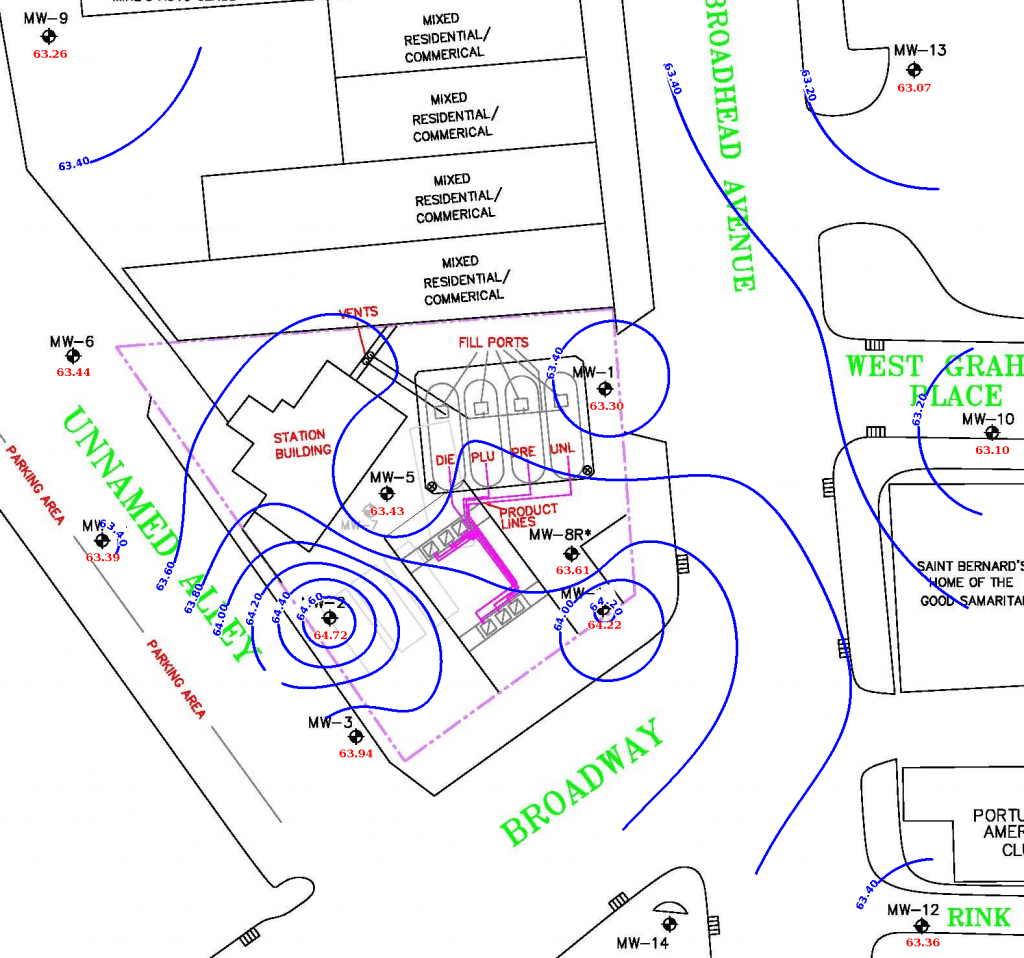
Groundwater Flow Direction Map
The groundwater flow direction map is a contour plot of the water table elevation data from each well. Groundwater flow is interpreted to be perpendicular to the contour lines from higher to lower elevations.
Groundwater flow direction maps can be created by manually plotting water table elevation data onto the appropriate locations on the site plan, manually sketching contour lines, and then using a CAD program to print out the final drawing; by using a contouring software program that is linked to a separate data spreadsheet and base map; or by using contouring software linked to a database.
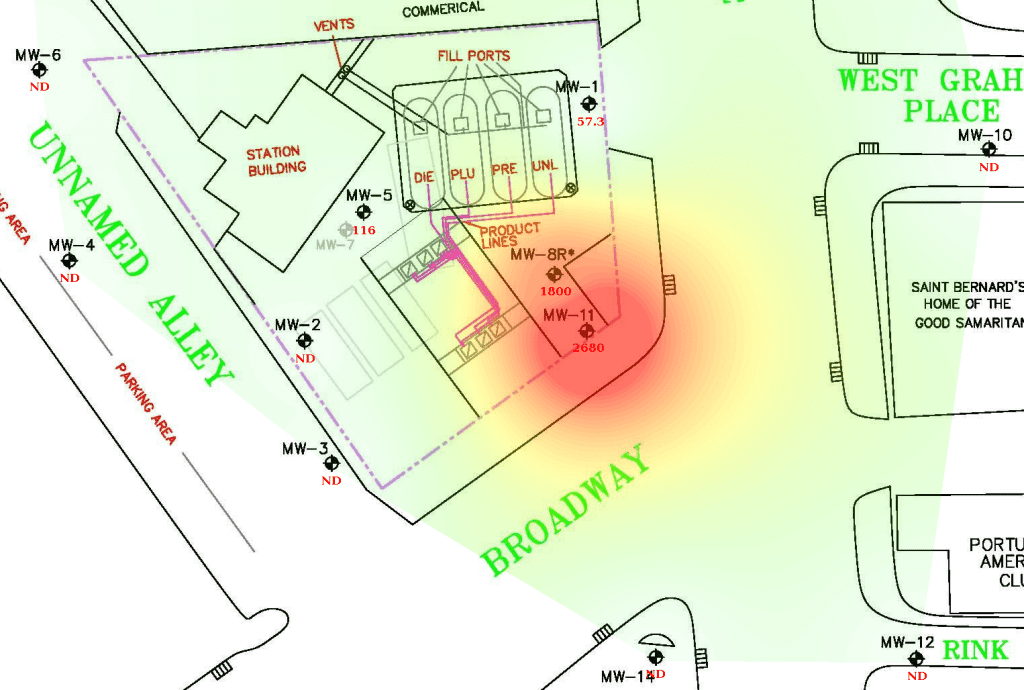
Contaminant Iso-Concentration Maps
Contaminant Iso-Concentration Maps are contour maps of laboratory data plotted at the monitoring well locations on the site plan. The contours depict the areal extent of the contaminant plumes. Most groundwater contamination projects will have a number of different chemical compounds that are measured and tracked. Since different chemical compounds have different properties, i.e. solubility, contaminant plumes may be different for each chemical and reports often require multiple complex maps.
Iso-Concentration Maps (or contaminant plume maps) can be created by manually plotting constituent data onto the appropriate locations on the site plan, then manually sketching contour lines, which can be an error prone process; by using a simple contouring software program that simply takes in data from a spreadsheet; or a far more sophisticated program that is linked directly to the database containing the records from the automated data uploads to achieve a far greater level of precision.
Statistical Analysis
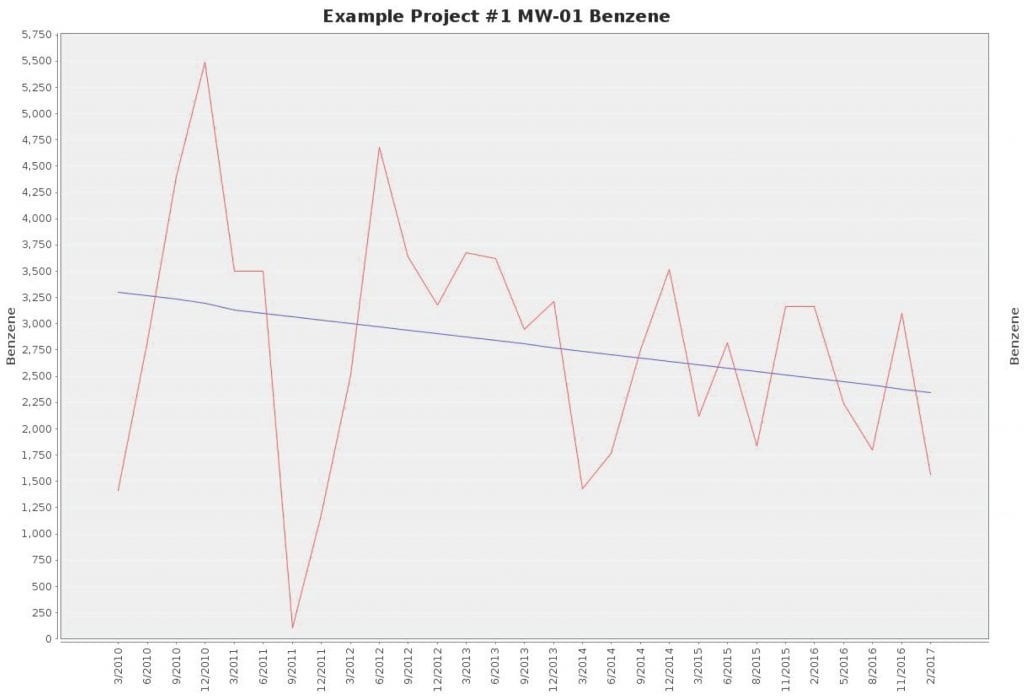
A statistical analysis is conducted to determine if well contamination is increasing, stable, or decreasing. Results are presented numerically and in chart form.
The statistical analysis can be conducted by manually entering chemical data into statistical spreadsheet models; by using statistical software linked to a simple spreadsheet; or by using robust software linked to a database containing all the monitoring data.
Summary of Information
The summary report page typically includes basic overview information for the site, such as:
- Site address
- List of the wells that were sampled and not sampled
- List of the wells that were gauged and not gauged
- List of the chemical compounds that were detected above standards
- List of the wells that contained chemical compounds above standards
- Primary groundwater flow direction
- An evaluation of the progress toward cleanup goals
- Remedial system performance data, if applicable
- Field notes
- Other information
The summary of information can be completed by manually compiling updated information into an old Microsoft Word document; by entering results into fields created on a simple template; or by using a software platform linked to a database that houses the information.

Technologies to Automate Groundwater Reports
There are various software technologies that can be used to facilitate preparation of the individual components of the reports, a combination of components, and in some cases, full reports.
Database Solutions
Software databases can be used as a solution to host automated uploads of data, provide access to the data for other applications (output to tables, mapping programs, statistical packages, etc.), and provide backup capabilities to ensure against data loss.
Benefits:
- Automated uploads eliminate time wasted on manual data entry
- Automated uploads eliminate the opportunity for transcription errors
- If mapping and statistical applications are connected to the database, data is only entered once and can be consumed in real time whenever necessary
- Data shared seamlessly with clients and colleagues
Drawbacks:
- Cost including: seat licenses, maintenance, disk space/cloud storage, and server capability
- Training
- Setup time
Solutions:
- MS Access https://products.office.com/en-us/access
- EQuIS http://earthsoft.com/products/professional/
- OptaHub https://optahub.com/
Mapping Solutions
Contouring software applications can create maps that far exceed the output and level of precision that standard CAD programs are capable of. Some programs receive simple input from spreadsheet-style data while others store more complex location information that allows maps to be quickly generated using previously entered information about a well.
Benefits:
- Automation removes multiple layers of data entry mistakes
- Automated contouring eliminates contour placement errors
- For database-connected mapping applications data is only entered once and can be efficiently called up and used for a map.
- Consistent company formats are easy to configure
- Many different maps can be created in a short period of time
- Data shared with clients and colleagues
Drawbacks:
- Cost
- Training
- Setup time
- Flexibility (No “professional judgment” interpretation of contour placement)
Solutions:
- ArcGIS http://www.esri.com/products
- OptaHub https://optahub.com
- Surfer http://www.goldensoftware.com/products/surfer
Statistical Analysis Solutions
There are a myriad of statistical applications that provide common analysis of data. Solutions range from stand alone packages to spreadsheet-based programs provided by the U.S. Environmental Protection Agency (EPA) and a number of state environmental agencies. Some of the applications have the ability to connect to a database while spreadsheet solutions commonly require manual data entry.
Benefits:
- Statistical package tied to a database eliminates time, expense, and danger of manual data entry
- Consistent look to deliverables regardless of user
- Data shared with clients and colleagues
Drawbacks:
- Cost including seat licenses and maintenance
- Training requirements
- Setup time
- Flexibility (output may not be identical to spreadsheet programs)
Solutions:
- EQuIS http://earthsoft.com/products/professional/
- OptaHub https://optahub.com
- EPA https://www.epa.gov/land-research/proucl-software
Report Summary Information Solutions
Software such as Microsoft Word allows users to develop report templates that can be used to expedite the summary information component of the report. There are also more robust software products that connect to a central database and automatically develop summaries of sampling information and perform complex analysis such as comparison of analytical results with health contaminant standards.
Benefits:
- Report writing package tied to a database eliminates time and expense of manual information entry
- Report writing package tied to a database eliminates the opportunity for transcription errors prevalent in manual entry
- Consistent look to deliverables regardless of user
- Data easily shared with clients and colleagues
Drawbacks:
- Cost including individual licenses and update packages
- Flexibility (output may not fit users requirements)
Solutions:

Groundwater monitoring reports can be generated manually or they can be automated. While it is difficult to get seasoned professionals to adopt new technologies, companies who embrace these tools can achieve tremendous advantages in speed, accuracy, quality, and labor savings. Early adopters of new technology may discover a tremendous competitive advantage over their competition.
If you have any questions about OptaHub, please visit https://optahub.com, or email Support directly at support@optahub.com.
You can also check out these other articles!
Five Mapping Features Not Found in Any Other Environmental Software
OptaHub Groundwater Monitoring Software Review: Jim Driscall
The Pros and Cons of Groundwater Monitoring Report Automation

