Common mistakes environmental consultants make
 In my career as an environmental consultant, I have reviewed thousands of reports. Most of the reports were required by state and federal environmental regulatory agencies to address groundwater, soil, and air contamination issues. The majority of my review time was not spent formulating new ideas for predicting contaminant flow or identifying opportunities to increase pollutant recovery. Instead, it was spent looking for stupid mistakes–the kind of mistakes that keep environmental consultants up at night, mistakes that could cause regulators to lose trust in my work, and mistakes that could cost my clients money. Below is a list of the top mistakes and some solutions to eliminate those errors.
Common Mistakes
-
Cut and paste errors
The easiest way to draft a report is to use previous reports as a template. The author uses a previous report as a template and then cuts and pastes additional information from similar projects to help build the final document. Cutting and pasting information from previous documents can save a lot of time. However, unless the final document is reviewed carefully, there may be material left in the report that pertains to other projects and even other clients.
-
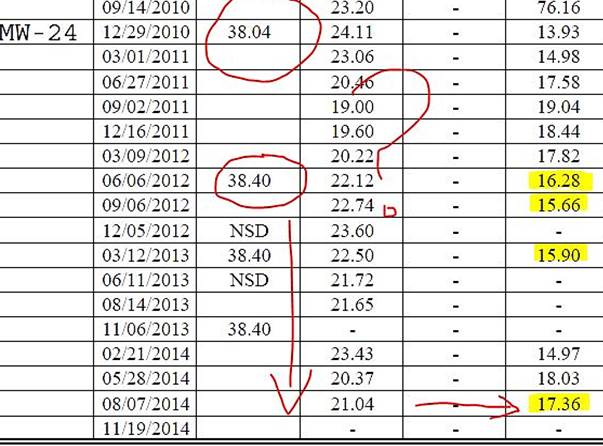
Data transformation
Environmental projects generate a lot of data. It is not uncommon to generate a list of over 50 different chemical compounds from a single sample point. There are usually multiple sample points as well as additional samples collected from the same samples points at different dates throughout the life of a project. This data has to be organized and formatted into summary tables. Since data does not always arrive from the laboratory in the same format as a summary table, it sometimes becomes necessary to enter the data into the table manually. When entering a lot of numbers it is very easy to make simple mistakes by mixing up or transposing numbers or sample locations.
-
Data entered into the wrong cell of a data table
With multiple chemical analyses and multiple sample points, it is very easy to enter a result in a wrong row or column in a table. Row and column errors result in data entered on the wrong dates or for the wrong chemical.
-
Data entered into the wrong table
Many environmental projects have similar well names and analytical requirements. It is very easy to enter a result under the wrong project ID or in a wrong table.
-
Formula carryover
Formulas are embedded into certain cells of a spreadsheet to perform calculations. Formulas are pasted into new cells as more data is entered into the table. It is very common for formulas to be pasted into an unintended cell or the wrong cell to be referenced and calculations to then be made with untended data. A simple example would be a formula that subtracts a depth to water measurement from a well casing elevation to arrive at a water table elevation. If the formula should reference a casing elevation from a different well, the resulting water table information would be incorrect. Formulas that reference multiple data cells for complex statistical calculations can be even more problematic.
Spreadsheet errors are not limited to environmental consultants. Here is a famous error made by prominent scientists: http://www.bbc.com/news/magazine-22223190
-
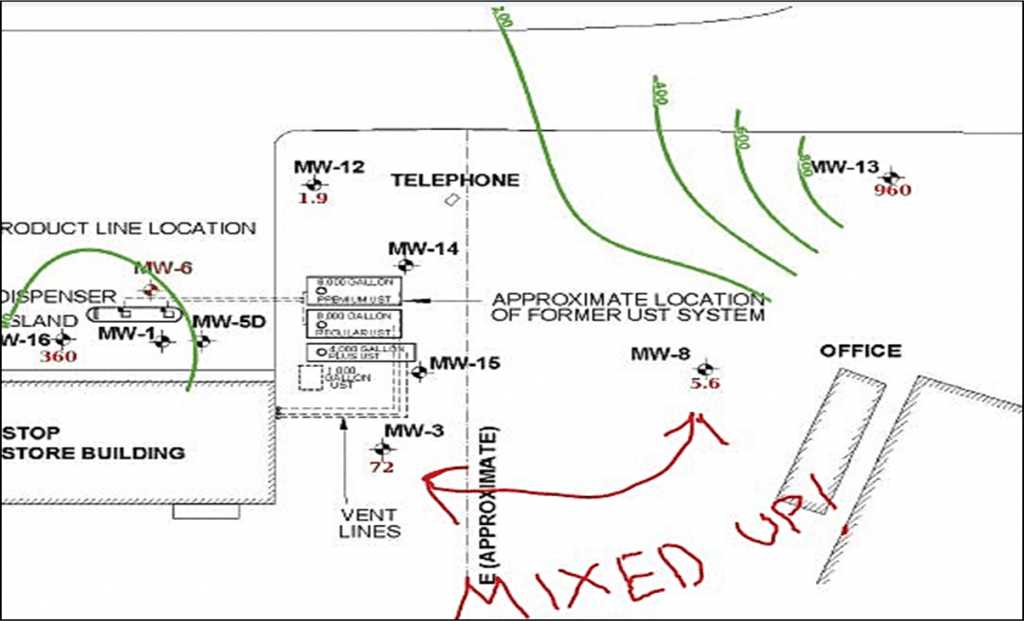
Data was plotted at the wrong well location
Chemical and physical data are plotted on maps to depict the areal extent of contamination and direction of flow. Environmental projects may have three to over 100 sample points. It is not uncommon to find data was mixed up and plotted at the wrong sample location.
-
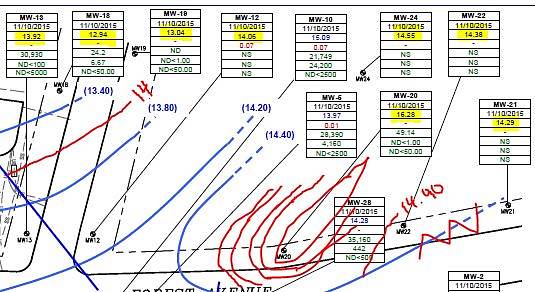
Contour lines were drawn incorrectly
With many data points on a map, drawing contours of equivalent data points can be very complex, and tedious. There are two common types of contouring mistakes:
1. Contour lines are drawn incorrectly, (i.e., the 2-foot contour is drawn between two 3-foot data points).
2. Contour lines are drawn outside of the data boundaries (i.e., the contours are extended outside the limits of the data).
-
No one looks at the data until right before a report is due
Large increases in chemical concentrations in well samples are an indication that a new spill has occurred. However, if no one reviews results until right before a report due date, the spill may have been ongoing for months and result in a much greater environmental impact.
-
Missed reporting deadlines
Project managers juggle many reports with varying priorities. Data comes in and sits on someone’s desk waiting to be entered into tables. Draft reports sit in a pile awaiting review. Stuff falls through the cracks.
-
Incomplete Reports
Different staff members and project managers may be involved with assembling various sections of a report. Historical data can be lost. Files can be misplaced. Computers can crash. Sections of the report can be misplaced. New staff may have a different understanding about what should be included in a report. It is not uncommon to encounter inconsistent reporting formats within the same company.
-
Report was submitted on time, but no one really looked at the data
In the hurry to get routine progress reports out by a deadline, and within budget, the consultant follows the reporting process but never really looks at the data. Data gaps may be providing misleading information, preferential contaminant flow paths may go undetected and changing conditions may contradict the conceptual site model. Compliance with regulatory deadlines is important, but information must be studied and processed in order to adjust strategies and achieve cleanup goals in a cost effective and expeditious manner.
-
Project is over budget
Quality assurance takes time. Mistakes have to be corrected. Changes to tables, maps, and text take time. Consultants live by billable hours. Non-billable time costs the consulting company money.
Mistakes Have Consequences
A simple error can become particularly onerous as it can propagate into the data set that is used in decision making, reporting to regulatory agencies, and reporting to stakeholders. Simple mistakes in the data can result in:
- Incorrect contaminant flow direction calculations
- Contamination identified where it does not exist
- Potential contaminants identified as within regulatory compliance when they are not
The consequences of decisions made with incorrect data can be expensive:
- Future samples collected in wrong locations
- Unnecessary additional off-site investigation
- Unnecessary additional monitoring wells
- Unnecessary additional sampling
- Unnecessary additional analyses
- Extended project life
- Unnecessary litigation expense
- Regulators lose confidence
- Loss of trust by clients
- Decline in reputation
Most of the time, mistakes end up being inconsequential or only result in consultant embarrassment. However, imagine what could happen if a spill response was postponed because discovery of contamination at a down-gradient receptor was delayed because of a preventable mistake.
Mistakes Can be Prevented
There are standard procedures that can be followed to reduce the possibility of mistakes:
- Create generic report templates
- Quality assurance checks after each data entry step
- Report checklists
- Peer review after each phase of the reporting process
- Set up master report schedules
Standard procedures can be effective in preventing errors. However, the best way to prevent mistakes is to eliminate the opportunity for them to occur in the first place. Modern technology can be used to manage data, eliminate mundane and redundant tasks and even provide data analysis–without being subject to human error. Capabilities of modern technology include:
- Export data directly from the laboratory to a cloud based database.
- Export data from the database to create summary data tables. Regulatory exceedences are automatically highlighted to make those important results stand out.
- Output data from the database to a mapping program to automatically plot the correct data in the correct location and construct contours that are located based upon proven mathematical equations.
- Output data from the database to a statistical analysis program to automatically calculate trend analyses and associated charts for data visualization.
- Automate the report generation process so that data comparisons, trends and summaries are presented in a clear and consistent manner.
Early adopters of modern technology can have a clear advantage over their competitors. The technology reduces opportunities for mistakes and automates clerical tasks so that the professionals can spend more time managing their projects instead of checking for simple mistakes.
Technology can also have drawbacks:
- Seat licenses and software maintenance costs may be too expensive for some smaller consulting companies and smaller project budgets.
- Technology solutions can be complicated and require specialized training.
- The database solution may not be compatible with the laboratory electronic data file output.
- The database may not be compatible with some mapping and statistical applications.
- Consultants may not want to change from “the way we have always done it.”
There are many technology solutions to choose from. However, not every solution is right for every company and every project. Check out the solutions listed below to see if this technology fits your needs. If you are not sure, contact the company and ask for a demo. It may just prevent you from making a disastrous mistake, and the automation features may end up saving you a lot of time in the process!
- ArcGIS http://www.esri.com/products
- Description: ArcGIS is a mapping and analytics platform. ArcGIS offers a unique set of capabilities for applying location-based analysis to your business practices. Gain greater insights using contextual tools to analyze and visualize your data. You can integrate data stored in your business systems and geo-enable any data from any source. Then share these insights and collaborate with others via apps, maps, and reports.
- Training: Everything from semester long college courses, seminars, books to free online training modules.
- Cost: $42/month per user
- EPA https://www.epa.gov/land-research/proucl-software
- Description: ProUCL version 5.1.002 (5.1) is the latest update of the ProUCL statistical software package for analysis of environmental data sets with and without nondetect (ND) observations. ProUCL version 5.1 is a comprehensive statistical software package with statistical methods and graphical tools to address many environmental sampling and statistical issues.
- Training: Two 3-hour archived webinars are available on the website.
- Cost: Free
- EQuIS http://earthsoft.com/products/professional/
- Description: EQuIS Professional is a powerful system letting you check, edit and load data and report, graph, and export data to many industry-standard visualization and analysis applications.
- Training: EQuIS 3 day course – $2,400 per attendee. Advanced Workshop $2,500/attendee. Online courses also available.
- Cost: $30,000+
- Microsoft Access https://products.office.com/en-us/access
- Description: Microsoft Access is a database management system (DBMS) that combines the relational Microsoft Jet Database Engine with a graphical user interface and software-development tools. It can also import or link directly to data stored in other applications and databases.
- Training: Third party, initial 2 day training courses $598.00. Many free online videos.
- Cost: $109.99
- OptaHub https://optahub.com
- Description: OptaHub is a cloud-based hub for data management, mapping, statistical analysis, and reporting in one application. Automatic upload of EDD files from laboratories, utilize any JPG base map, generate on map x-y coordinates, output PNG map files, or automated PDF reports with text summary, data tables, statistical charts, and maps.
- Training: Intuitive User Interface. Access how-to videos and manual from the website. Approximate training time is one hour. Free tech support.
- Cost: $39/month per project. Unlimited users.
- Surfer http://www.goldensoftware.com/products/surfer
- Description: Surfer is a powerful 2D and 3D mapping, modeling, and analysis program designed to facilitate a deeper understanding of geospatial data. The wide variety of import and export formats allow users to seamlessly integrate Surfer into their daily workflows.
- Training: Online initial training class $350.00. Online support FAQ.
- Cost: $849 per user
Data management is a major issue for most organizations both inside and outside of the environmental field. Most environmental firms–and their clients–will invest heavily in financial and accounting software but are still reluctant to invest in data management applications. The mistake-proofing advantages afforded by advances in modern technology have begun to change this mindset.
To learn more about the software that will help you avoid mistakes in your reports, check out these articles:
Five Mapping Features Not Found in Any Other Environmental Software
How to Prepare Groundwater Monitoring Reports
OptaHub Groundwater Monitoring Software Review: Jim Driscall
The Pros and Cons of Groundwater Monitoring Report Automation