 Environmental regulations require specific formats for presentation of data at groundwater contamination sites. Many of the mapping procedures are done by hand and have been unchanged for over two decades. There are software companies that offer contour mapping programs, but there are issues unique to environmental projects that make these programs problematic. In this article I will present five mapping features not found in any other environmental software that are unique to the automated map generation module in the OptaHub cloud platform.
1. Wells with Liquid Phase Hydrocarbons are mapped within chemical contours
Environmental regulations require routine reports that include contour maps depicting the extent of contamination. A common issue with generating dissolved hydrocarbon maps for petroleum-contaminated sites is there are often wells that contain liquid phase hydrocarbons (LPH) while other wells have only dissolved hydrocarbons. If the contour maps are generated by hand, it is easy to place the LPH wells at the center of contamination and contour the extent of dissolved hydrocarbon concentrations around the source. These types of maps have been generated by hand for years. However, there are often transcription mistakes, errors drawing the contour lines, and a significant amount of drafting time for each map. Consultants have attempted to reduce the opportunities for errors and speed up the drafting process by using software to generate contours.
An issue arises when using traditional contouring software because there is no dissolved hydrocarbon data for the wells that contain LPH. Therefore, since there is no dissolved hydrocarbon data, the software does not include the LPH wells within the hydrocarbon plume. A work-around would be to enter fake data into the database, have the software draw the contours, and then remove the fake data from the database and manipulate the maps to cover up the fake data labels.
The work-around completes the objectives, but there is a time penalty. Another work-around would be to collect samples from the free product wells, but that would incur an unnecessary expense and the laboratories do not appreciate when extremely contaminated samples are put through their instruments.
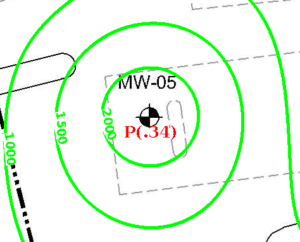
The mapping feature in OptaHub handles the LPH versus dissolved hydrocarbon mapping issue in a unique manner. When the application queries the database for data from a particular well and there is no dissolved hydrocarbon value, it then checks for an LPH thickness. If there is an LPH thickness, the product thickness is printed beneath the well, noted with a P, and this well is contoured equivalent to the highest benzene concentration mapped on site.
Click on the photo below to see an example of a Benzene Concentration Map.

2. Uniquely-colored contour line with a site-specific MCL value
Regulators or clients often want to see a specific contour of the MCL standard for a particular compound. This requirement can be achieved in two ways: (1) use a CAD program to draft and color the contours by hand or (2) use a work around with a contouring program. With other contouring programs you can select your contours to start with an MCL value but then all of the subsequent contours have to be a multiple of that value—and they just don’t look right. For example, if a consultant wants to create a Benzene iso-concentration map with a concentration line at an MCL of 5, the contours would have to be 5, 505, 1005, etc. Also, an uninformed viewer would not know that the 5 contour depicted the MCL.
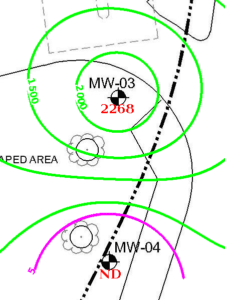
Using the mapping feature in OptaHub, a uniquely colored MCL contour is added to the map. This contour line can be any value and does not have to match one of the standard intervals.
Click on the photo below to see an example of the new MCL contour.

3. On-map X-Y coordinate selection
Most mapping software tools require X-Y survey or GPS data correlated to a specific map. Many small projects do not have a budget for detailed well coordinate and mapping feature surveys. A specific survey also may limit the user to one map, or in the case of GPS, only geo-referenced maps. With OptaHub, any map image can be used. The user simply has to click on the wells and map specific X-Y coordinates are generated.
4. Multiple maps can be created in seconds
Groundwater flow and chemical iso-concentration maps for multiple sample dates and chemical compounds can be created in OptaHub in seconds. A user merely has to click on the ‘Date’ menu, select a sampled date from the list, select a constituent to contour and select ‘Generate’. If there is new laboratory data for a project site, it can be automatically uploaded to the OptaHub cloud database and maps can be generated with no additional data formatting.
5. Base maps can be changed in minutes
If the user wishes to change base maps, a new map can be uploaded and X-Y well coordinates can be reassigned in minutes. Users often wish to utilize different maps to show a larger scale, update structures, or add new monitoring wells. No specialized skill is required and an updated base map can be uploaded by anyone on the project team. The user selects the ‘Map Upload’ interface to upload the new base map, then selects the appropriate well ID from the menu and then clicks on the well location to reassign the well coordinates.
Adoption of new technology is hard
Good habits can be our greatest strength and our greatest weakness. Good habits allow us to provide good consistent analysis and management of our customer’s environmental issues. Habits can also sometimes be a powerful force in resisting change. Fear of change may also be a limiting belief that is holding back adoption of modern technologies that can reduce errors and provide tremendous efficiencies. If you would like to find out more about efficiencies other companies are obtaining, check out OptaHub.com or contact us directly at support@optahub.com.
For more information about groundwater monitoring report automation, check out these articles:
How to Prepare Groundwater Monitoring Reports
OptaHub Groundwater Monitoring Software Review: Jim Driscall
The Pros and Cons of Groundwater Monitoring Report Automation
Top 12 Mistakes Made By Environmental Consultants